Table of Contents
Continuing the Hatching Test experiment.
Lines
(defun line2 (from to)
  (add-shape (make-line from to)))
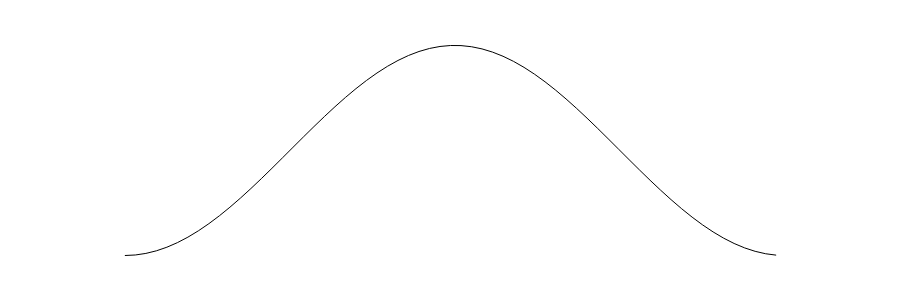
Function Plot
(with-scene
    (let ((step 0.1))
     (loop
       for x from 0 to (- (* 2 PI) step) by step
       do (line2 (vec2 x (cos x)) (vec2 (+ x step) (cos (+ x step))))))
  (plot-2d "images/line_density/sine.png" :format "30,10"))
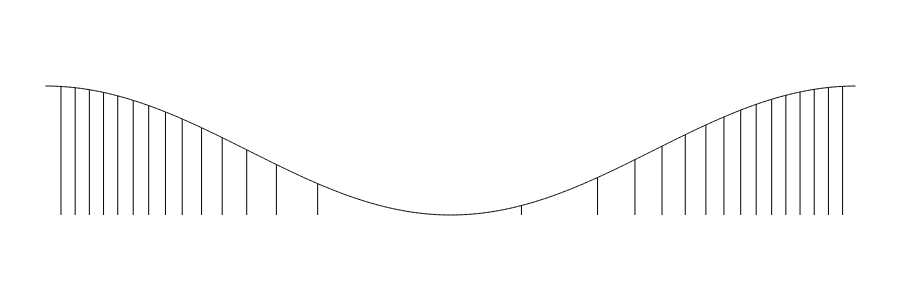
Integration
- Step along function in small increments, approximate integra
- Once limit is reached, draw a line
Line density is defined by a function
 .
.
(defun density (x) (/ (+ (cos x) 1) 2))
Approximation of

(defun area (f a b)
  (/ (* (+ (funcall f a) (funcall f b)) (- b a)) 2))
(with-scene
    (let ((step 0.01) (limit 0.10))
     (loop
       for x from 0 to (- (* 2 PI) step) by step
       for area = 0.0 then (+ area (area #'density x (+ x step)))
       do (progn
        (line2 (vec2 x (- 1.0 (density x))) (vec2 (+ x step) (- 1.0 (density (+ x step)))))
        (when (> area limit)
          (line2 (vec2 (+ x step) (- 1.0 (density (+ x step)))) (vec2 (+ x step) 1.0))
          (setq area 0.0)))))
  (plot-2d "images/line_density/sine_density.png" :format "30,10"))
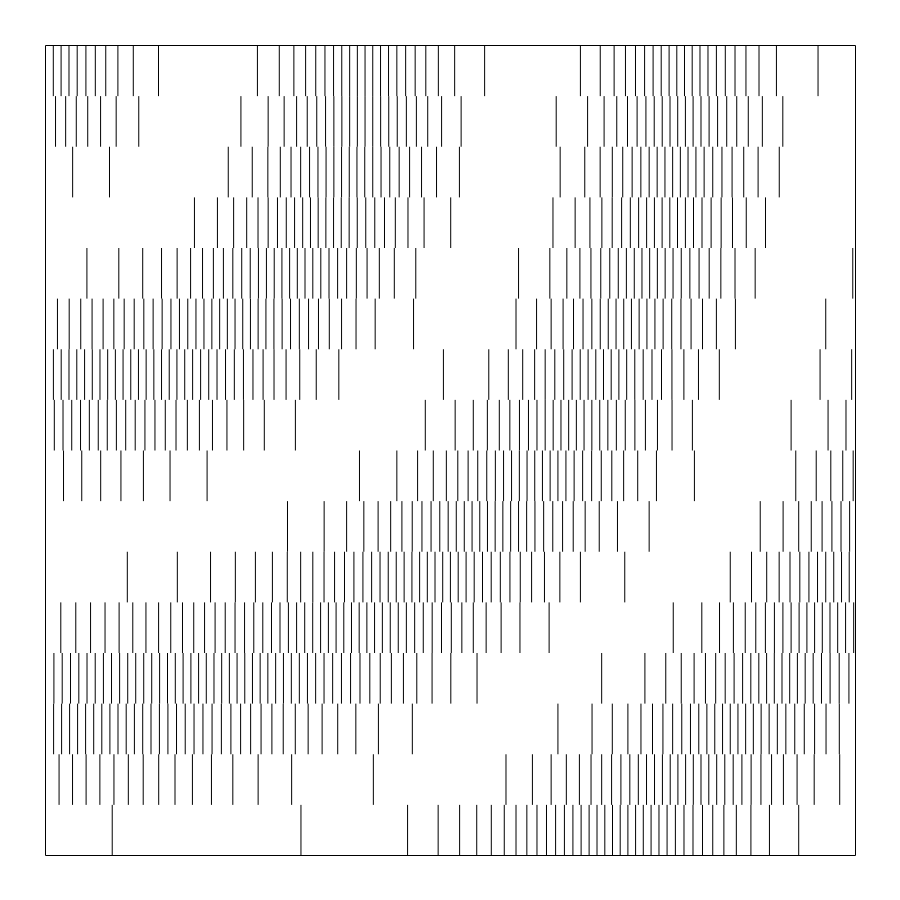
Repetition
(with-scene
    (let ((step 0.002) (limit 0.15) (size 16))
     (loop for y from 0 below size do
      (let ((density (lambda (x) (/ (+ (cos (* 1 (norm (sub (vec2 x y) (vec2 0 0))))) 1) 2))))
     (loop
       for x from 0 to size by step
       for area = 0.0 then (+ area (area density x (+ x step)))
       do
        (when (> area limit)
          (line2 (vec2 (+ x step) y) (vec2 (+ x step) (1+ y)))
          (setq area 0.0)))))
  (line2 (vec2 0 0) (vec2 size 0))
  (line2 (vec2 size 0) (vec2 size size))
  (line2 (vec2 size size) (vec2 0 size))
  (line2 (vec2 0 size) (vec2 0 0))
  (plot-2d "images/line_density/line_density.png" :format "30,30" :palette "/home/leon/src/generative/bw.json")))
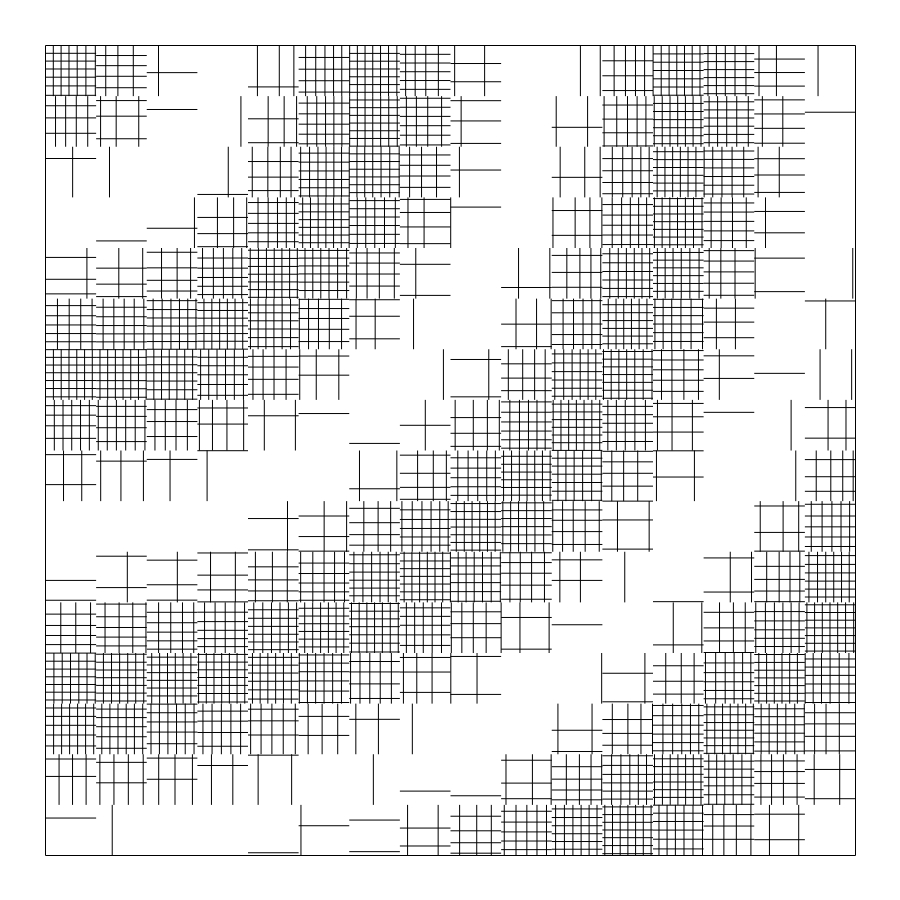
Both Directions
(with-scene
    (let ((step 0.002) (limit 0.15) (size 16))
      (loop for y from 0 below size do
        (let ((density (lambda (x) (/ (+ (cos (* 1 (norm (sub (vec2 x y) (vec2 0 0))))) 1) 2))))
          (loop
            for x from 0 to size by step
            for area = 0.0 then (+ area (area density x (+ x step)))
            do
               (when (> area limit)
                 (line2 (vec2 (+ x step) y) (vec2 (+ x step) (1+ y)))
                 (setq area 0.0)))))
      (loop for x from 0 below size do
        (let ((density (lambda (y) (/ (+ (cos (* 1 (norm (sub (vec2 x y) (vec2 0 0))))) 1) 2))))
          (loop
            for y from 0 to size by step
            for area = 0.0 then (+ area (area density y (+ y step)))
            do
               (when (> area limit)
                 (line2 (vec2 x (+ y step)) (vec2 (1+ x) (+ y step)))
                 (setq area 0.0)))))
      (line2 (vec2 0 0) (vec2 size 0))
      (line2 (vec2 size 0) (vec2 size size))
      (line2 (vec2 size size) (vec2 0 size))
      (line2 (vec2 0 size) (vec2 0 0))
      (plot-2d "images/line_density/line_density2.png" :format "30,30" :palette "/home/leon/src/generative/bw.json")))